


















OUISTARS Travel Magazine Analysis | Tourism economics and public policy
A country can build an exceptional hotel and museum, then lose the booking because the flight no longer operates or the traveller no longer feels confident. An image wins attention; trust converts that attention into a paid stay and a return visit. The tourism contest is bigger than the tallest landmark or the loudest campaign.
Who takes the largest share: Europe, led by France, the Middle East and the Gulf, or Asia with destinations such as Bali? First we must define the pie. This analysis measures international tourist arrivals, not beauty, net profit or a composite destination award. It then asks who can protect demand when politics, air access and prices change.
Our proposition is that long-term tourism strength belongs to countries that keep improving everyday life at home and limit avoidable exposure to external conflict. That is an editorial argument to test, not a universal law that every international engagement produces a measurable tourism loss.
Original conceptual editorial still life: a globe and symbolic miniature destinations, not an actual geographical scene or a data map.
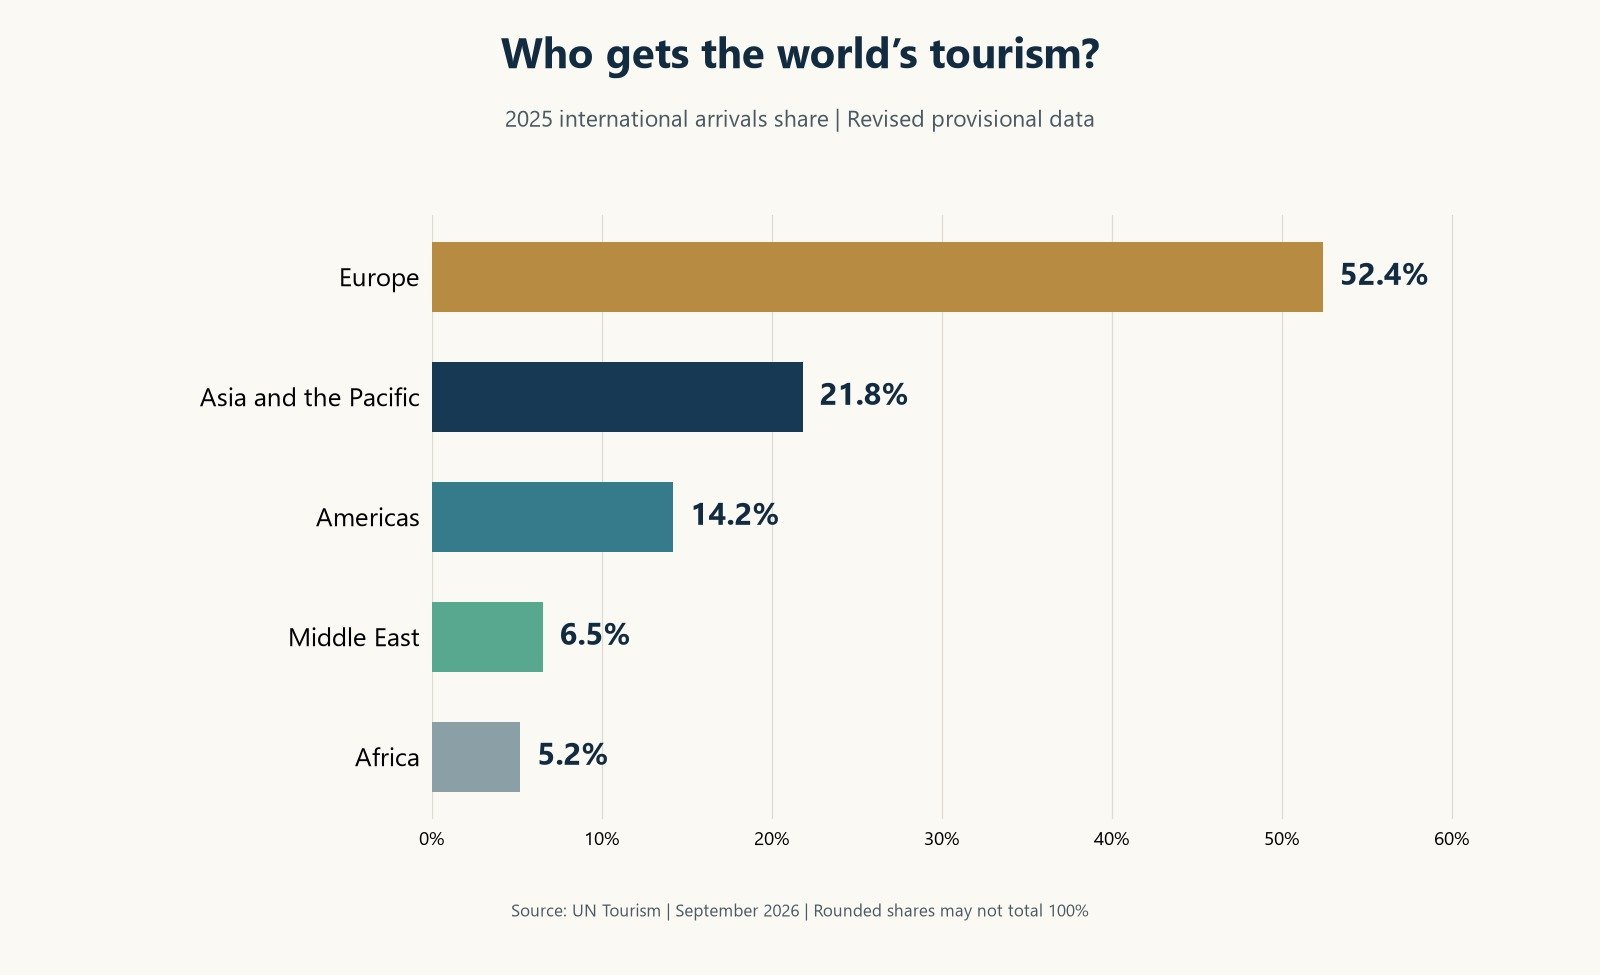
The 2025 pie: Europe first, Asia and the Pacific second, the Americas third
| Rank | Region | Arrivals, millions | World share |
|---|---|---|---|
| 1 | Europe | 808.3 | 52.4% |
| 2 | Asia and the Pacific | 336.6 | 21.8% |
| 3 | Americas | 219.3 | 14.2% |
| 4 | Middle East | 100.2 | 6.5% |
| 5 | Africa | 79.6 | 5.2% |
Download chart data as CSV (English region names, source URL and edition date)
The largest share is not the fastest growth—or the largest profit
Europe retains more than half of international arrivals. That is a formidable demand base, not proof that every business or destination is thriving. Visitor numbers can rise while stays shorten or operating costs absorb the extra revenue. A smaller destination can generate more value per night without winning the volume contest.
The pie also grows and contracts. Two destinations can expand together. One can welcome more arrivals yet lose share if the global total grows faster. Every success announcement should therefore answer three questions: how much additional demand, how much additional economic value, and what happened to the destination’s share?
Arrivals, receipts, nights and resident sentiment answer different questions. Tourism income is not net profit: wages, imports, energy and financing all matter. Good policy chooses a measure that fits its objective instead of selecting the largest available headline number.
France, Egypt, Saudi Arabia, the UAE and Bali: compare the right units
France reports 102 million international visitors in 2025 and identifies itself as the world’s leading destination. Spain records about 96.8 million international tourists, while the U.S. government source puts U.S. arrivals at 68.3 million. These are national annual figures, not a complete final UN ranking for every country.
France is not Paris alone, and UN Tourism’s Europe is not simply the European Union. A capital can inspire the first trip, while regions, coasts, villages and local culture extend the stay and distribute its value. France’s lead cannot be turned into a claim that Paris leads every city metric.
The UN Tourism Middle East table records 29.3 million Saudi arrivals and 19 million Egyptian arrivals for 2025. Saudi reporting includes several travel purposes, including religious tourism. Egypt’s strong cultural and coastal appeal does not justify declaring it the regional volume leader without supporting evidence.
Dubai’s 19.59 million international overnight visitors are an emirate-level 2025 measure. The more than 32 million UAE hotel-establishment guests cover a different geography and statistic. Hotel guests cannot simply replace international arrivals at frontiers. Nor should emirate figures be added without checking duplication and definitions.
Bali is a destination within Indonesia, not a country or region comparable with Europe. BPS Bali records 6,948,754 direct foreign arrivals in 2025. That excludes visitors whose Indonesian entry was elsewhere and does not represent all Indonesian tourism. Visibility on social platforms does not change the unit of analysis.
For a ministry or investor, these distinctions affect real decisions. Mixing indicators can distort the case for hotel capacity, an airline route or a promotion budget. A large number is useful only when its coverage is understood.
2026: how disruption moves demand
UN Tourism’s first-half 2026 summary reports global arrivals growth of just 0.4% and a 22% fall in the Middle East, while Europe grew about 3%. These are period results, not the outcome of a year that has not finished.
The mechanism is rarely a single vote against a country. A hotel can remain open and a landmark accessible while flights disappear, connections lengthen, fares rise or tour operators postpone a programme. A distant destination can be affected because its visitors connect through a disrupted hub.
A country exposed to a conflict is not necessarily a participant in it. An economic loss does not establish political responsibility. Nor does weaker Gulf demand automatically become a booking for Egypt or Bali: routes, prices, entry conditions and confidence determine the actual alternative.
In our view, a competitive destination does not promise that nothing will ever go wrong. It reduces uncertainty and manages disruption through clear information, operational alternatives and a response that neither denies the problem nor exaggerates it.
Can foreign policy cost tourism? Sometimes—but causation needs evidence
A policy that raises the risk of airspace disruption, alienates a major source market or makes entry harder can increase the cost of winning visitors. But an arrivals series alone cannot isolate the effect of external intervention. Exchange rates, incomes, weather, capacity and competitors are moving too.
The U.S. Travel Association records a 5.5% fall to 68.3 million international visits in 2025, led by reduced Canadian travel, and flags visa barriers and negative sentiment as risks. That illustrates the importance of access and welcome; it does not assign the entire decline to one cause.
UN Tourism’s Middle East conflict brief documents flight disruption, airspace restrictions and confidence effects. Those are mechanisms institutions can monitor, rather than treating every affected destination as a belligerent or making unsupported claims about governments’ motives.
Our editorial position favours avoiding unnecessary escalation and investing in the domestic conditions that sustain trust. This is not an argument for isolation. Diplomacy, cultural exchange, aviation agreements and international cooperation can support tourism; they are not equivalent to interference in another country’s affairs.
The last-village test: does quality extend beyond the capital?
A destination should aspire to a respectable standard of service in its most distant village as well as its showcase capital. This does not mean making every place look identical. It means a reliable baseline of dignity, cleanliness, safety, access and information while preserving local differences.
Travellers experience a chain: the border, the road, the toilet, the price, the complaint and the availability of help. An exceptional resort cannot repair every weak link outside its gates. Training workers and improving residents’ daily lives are part of the tourism offer, not a separate social afterthought.
Authorities can test this proposition by mapping nights and expenditure, comparing services beyond major gateways and asking whether residents benefit. If gains remain concentrated in one polished enclave, the headline can grow while the foundations of lasting competitiveness weaken.
Why public-health institutions have a stake
The WHO report on the health–tourism relationship connects tourism management with health systems, emergency preparedness and inclusion. Its travel-and-health guidance identifies food, water, sanitation, access to care and accessible facilities among destination-related risk factors.
Our policy inference is that everyday quality for residents also forms a visitor-confidence infrastructure. Tourism should work with health, water, transport and municipal authorities before peak seasons, rather than bring them into the room only after an incident. Shared planning benefits both visitors and the host population.
This article creates no invented health ranking and offers no individual medical advice. The institutional questions concern seasonal service capacity, understandable emergency arrangements and whether older travellers and people with disabilities can actually use the destination.
Our outlook: who is better placed to gain?
UN Tourism’s current official outlook is for global arrivals to grow 1% to 2% in 2026, down from its January forecast of 3% to 4%. This is a forecast range, not a final annual result. Our scenarios ask who is better placed within that slower-growing market.
Base scenario: we expect Europe to retain its volume lead in the near term because its existing base is large, not because it lacks problems. Some Mediterranean destinations may attract travellers seeking more predictable access. This is an editorial scenario, not an official 2026 ranking forecast.
Stability-and-recovery scenario: improved air continuity and confidence could help Gulf destinations recover demand. Egypt could convert cultural and coastal interest into longer stays and local value. Recovery would be uneven: practical delivery and air capacity matter more than a project announcement.
Renewed-disruption scenario: travellers could choose nearer and simpler journeys, or travel less because of cost. Bali would not be an automatic winner: it also relies on long-haul connections and local capacity to manage visitors.
Europe can erode its advantage if tourism pressures housing, water and daily life without an effective response. A smaller destination can succeed through local value, repeat custom and resident acceptance even without leading arrivals. Stability matters alongside price, service, connectivity and the host community.
Our conclusion is that balanced domestic development and peaceful international openness offer a stronger foundation than a spectacular image alone. They can protect competitiveness over time; they do not mechanically make every country the world’s number one.
What should ministries and tourism bodies measure next?
| Institution | Proposed measure | Decision question |
|---|---|---|
| Tourism authority | Arrivals, nights, real receipts and return visits | Is growth creating value or only volume? |
| Aviation and borders | Route reliability and entry-processing time | Can visitors arrive predictably? |
| Municipalities and health | Water, sanitation, access to care and emergency response | Do services support residents and seasonal demand? |
| Regional development | Geographical distribution of nights, spending and jobs | Does the benefit extend beyond the capital? |
| Investment agencies | Actual demand, operation and local procurement | Does new capacity add durable value? |
This is a measurement agenda proposed by the magazine, not an internationally certified index or a country health ranking.
The ranking summary: what can be said about 2025?
| Comparison | Result | Interpretation limit |
|---|---|---|
| World regions | 1 Europe; 2 Asia and the Pacific; 3 Americas | International arrivals, revised September 2026 UN table. |
| Leading country worldwide and in Europe | France: 102 million in its national 2025 results | Not a Paris city ranking or a receipts lead. |
| Middle East published-share comparison | Saudi Arabia 29%; UAE 27%; Egypt 19% | April 2026 UN brief using January reference data. The UAE share is estimated, not a complete national arrivals result. |
| Gulf within that share table | Saudi Arabia precedes the UAE in the published comparison | Based on that table’s reported/estimated shares, not a complete annual table for every Gulf state. |
| Final 2026 winner | Not determined as of 2 November | Partial-year results and forecasts cannot replace full-year statistics. |
Every comparison retains its metric and year. We do not carry an older complete ranking into 2025 or turn hotel guests into frontier arrivals.
Questions for travellers and policymakers
Which region has the largest tourism share?
Europe: 52.4% of international arrivals in 2025 in UN Tourism’s revised September 2026 table.
Does Egypt lead the Middle East by tourist arrivals?
The table used does not support that claim. It records 29.3 million Saudi arrivals and 19 million Egyptian arrivals, with some other national data incomplete.
Is Dubai’s visitor total the UAE total?
No. Dubai’s 19.59 million international overnight visitors in 2025 cover Dubai, not all UAE hotel guests.
Is the 2026 winner already known?
No full-year result exists at the review date. This analysis distinguishes partial results and conditional scenarios.
Does every country involved in conflict necessarily lose tourism?
Conflict can damage access, costs and confidence, but effects and causation differ; uninvolved destinations may suffer through proximity or air routes.
Sources and method
Sources reviewed 2 November 2026. The world table uses the September edition; Middle East country shares use the April brief and its estimates footnote. National, city and island figures retain their published coverage. Outlook and recommendations are the magazine’s analysis, without sponsorship or endorsement by the institutions mentioned.
- UN Tourism: September 2026, version 8 October, regional table on page 6
- UN Tourism: latest performance and outlook
- UN Tourism: 15 April 2026 brief, Table 1 and estimated-share footnotes
- French Economy Ministry: 2025 tourism results
- Spain INE: FRONTUR, year 2025
- U.S. Commerce Department: 2025 base and forecasts
- U.S. Travel Association: 2025 decline and demand risks
- DataSaudi, Economy and Planning Ministry: 2025 tourism
- Dubai DET: international overnight visitors in 2025
- Dubai Media Office: UAE hotel-establishment performance in 2025
- BPS Bali: 2025 direct foreign arrivals
- WHO: Understanding the health and tourism nexus, 2025
- WHO: Travel and health
Related reading
- Riyadh Season 2026: Events, Tourism and Regional Risk
- The airport as a test of the national system (Arabic)
For tourism-policy readers: share the analysis and discuss which indicators should come before the size of an advertising budget.